In a previous article, Assigning Severity Ratings to Safety Observation Findings, the concept of incorporating severity into standard safety observations for unsafe/at-risk observation findings was suggested. Doing this would allow observers to classify findings according to their potential level of risk. There are several tangible benefits from this process such as improved communication, enhanced prioritization of hazard corrections, and calibration of risk ratings among observation teams. In addition to these overall benefits, enhanced metrics can be developed and utilized to better assess risks.
Severity, as used in this context, refers to the degree of risk associated with a behavior or condition. Factors that impact the severity include the probability that an adverse event will occur due to a hazard as well as the consequences or harm from the hazard from an adverse event. Assuming there is exposure, there is a typical, basic risk matrix used to determine the severity of a finding, as shown below.
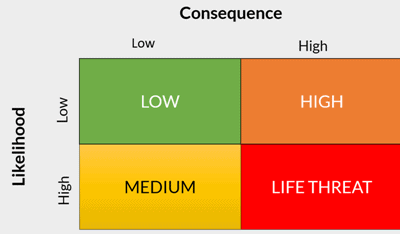
Since each unsafe finding is different, each unsafe observation finding should be assigned a severity level. Hazards such as Fall Protection or Electrical can be assigned higher risk ratings whereas hazards such as Housekeeping and Personal Protective Equipment can assigned lower risk ratings, as determined by the perceived potential impact. While the severity rating is assigned, it is not usually included in typical safety observation metrics. Normally, the determination is only given a naming assignment, such as High or Low, making broader risk ratings and subsequent comparisons across a group or organization more difficult.
As discussed in another previous article, Percent Safe is NOT a Risk-based Performance Indicator, percent safe does not take the severity assignment into consideration. For example, if 100 findings were collected and one of them was at-risk or unsafe, this would result in a percent safe of 99%, regardless of the severity.
An alternative is to develop a new metric – Weighted Percent Safe. In determining this metric, each severity level is assigned a value, which is used in the new calculation. Here is an example of representative values:
- Low = 1
- Medium = 5
- High = 10
- Life Threat/Life Critical/IDLH = 20
Instead of each unsafe observation counting the same as a safe observation in a 1:1 ratio, each unsafe finding would count more if a higher severity finding were assigned. For example, one medium unsafe would count as five unsafe observations when compared to the collected safe observations when determining the new, weighted ratio.
If we take the same example of 100 total observations with one of them being unsafe, the new, weighted values would be as follows:
• Low = 99%
[Observation total is 99 safe + 1 unsafe = 100 total. 99/100 = .99 or 99%]
• Medium = 95.2% *[W]
[New observation total is 99 safe + 5 unsafe = 104 total. 99/104 = .952 or 95.2%]
• High = 90.8% *[W]
{New observation total is 99 safe + 10 unsafe = 109 total. 99/109 = .908 or 90.8%]
• LT = 83.2% *[W]
[New observation total is 99 safe + 20 unsafe = 119 total. 99/119 = .832 or 83.2%]
Bear in mind, if a weighted value is not used, each of these results would show as 99% safe. Additionally, these are examples with just one unsafe added. If multiple unsafe findings are added, then of course the calculation changes. By utilizing a Weighted Percent Safe metric, it will be easier to track and trend risk better, which will, in turn, allow the risk to be proactively managed. This would allow an organization, with a single metric, to assess risk values quickly and easily across the enterprise.
For more details: Click here & Contact SafetyStratus Now.
AUTHOR BIO

Cary comes to the SafetyStratus team as the Vice President of Operations with almost 30 years of experience in several different industries. He began his career in the United States Navy’s nuclear power program. From there he transitioned into the public sector as an Environmental, Health & Safety Manager in the utility industry. After almost thirteen years, he transitioned into the construction sector as a Safety Director at a large, international construction company. Most recently he held the position of Manager of Professional Services at a safety software company, overseeing the customer success, implementation, and process consulting aspects of the services team.
At SafetyStratus, he is focused on helping achieve the company’s vision of “Saving lives and the environment by successfully integrating knowledgeable people, sustainable processes, and unparalleled technology”.